
2016 P1 Registration Oversubscription Risk
 Submitted by
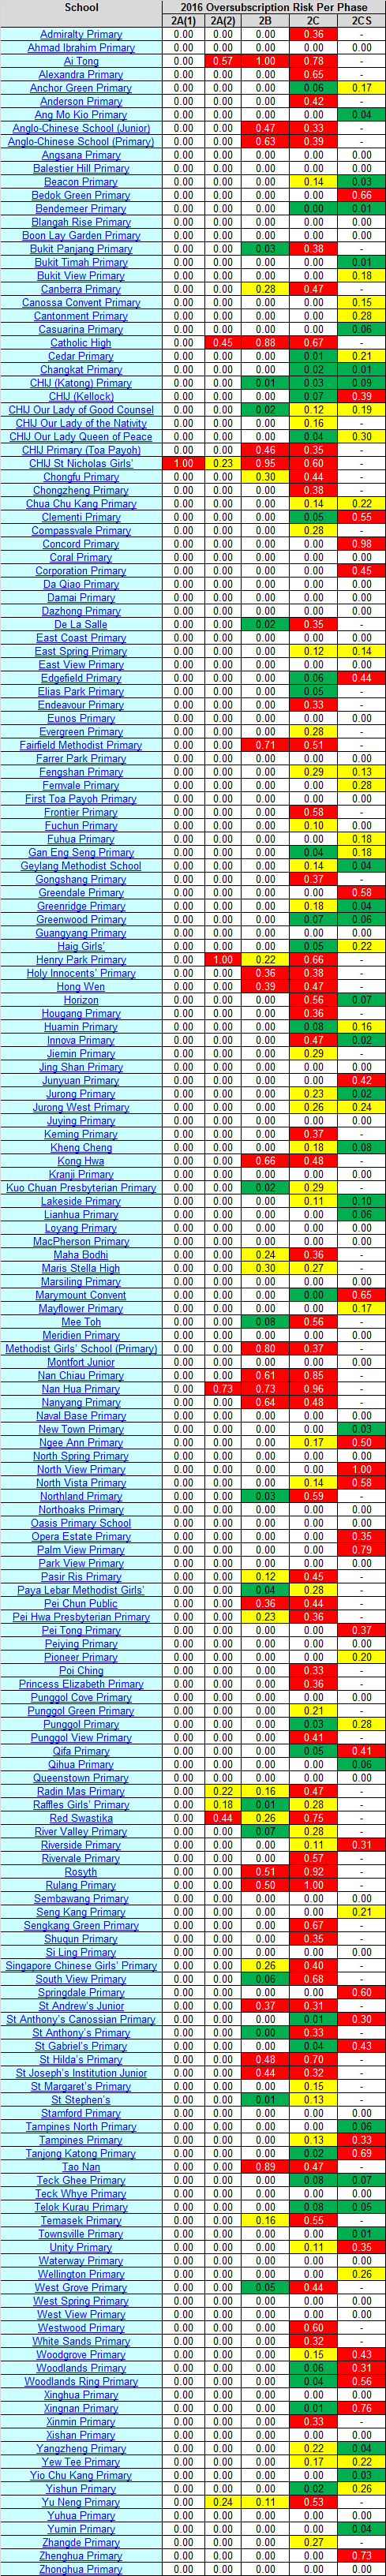
 As the 2016 Registration for 2017 Primary One students approaches, it is time to evaluate your child’s chances to get into your desired school. To help parents, we have computed the oversubscription risk for each school, taking into account the registration history for the past 10 years (2006-2015).
Legend:
Red = High risk of oversubscription in that Phase
Yellow = Medium risk
Green = Low risk
No color = No risk
“-” = There are no more vacancies in the Phase
The risk value is normalised to between 0.0 and 1.0 based on the school with the highest risk for the Phase. It is computed on a weighted average (the recent years being more important) based on the application rate and the type of balloting that may occur for each Phase.
Edit 26 June 2016:
The chart has been updated to better reflect the oversubscription risk of schools which have been consistently oversubscribed every year. Essentially, schools with risk values >0.3 are at high risk of oversubscription because they have been oversubscribed every year.
For more information, please refer to the detailed balloting history for each school, which can be found here.
Other useful links:
Primary Schools Balloting History