
PSLE 2013 Results – A Simulated Analysis – Fine-tuned
Here are a few thoughts of mine on PSLE 2013 results. MOE/SEAB should be publishing the t-score distribution which would greatly help pupils to understand where they are in the cohort so they could apply the right schools. But I never found these info from MOE/SEAB web site.
1. What could be PSLE 2013 T-score distribution?
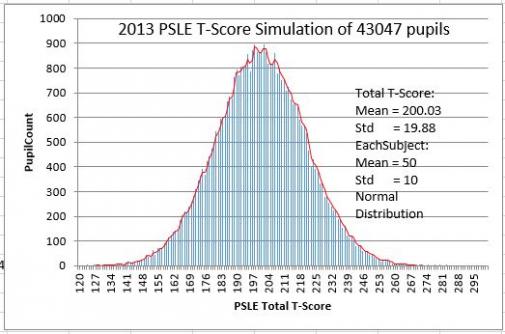
If we treat the raw scores of English/Math/Science/MT as random variables, the total sum of the raw scores should be approximately normally distributed. It’s also true for the total T-score which should also be in normal distribution. This can be proved by mathematical simulations and is also guaranteed by the central limit theorem.
To determine the total T-score (i.e. the sum of 4 subjects’ t-scores) distribution, we need know the number of pupils (43047 for 2013), the average of total T-scores (it should be 200) and the standard deviation std. The std is greatly impacted by the raw score’s distribution. If we assume all 4 subjects raw scores are in normal distribution, we can prove that the std of total T-score should be around 20 by doing Monte Carlo simulation. This is illustrated in the following chart.
Thanks to the readers who questioned me why there are so few pupils over 250 or 260? After I modified the distributions of raw scores and played with the simulation parameters in late nights of last two days, I think to assume the std = 20 is not the best estimation.
My revised simulation results shown that std=25 is a better choice. We can conclude the following from the mathematical simulation (i.e. Monte Carlo). The cumulated % of pupils is shown as the curve in brown.
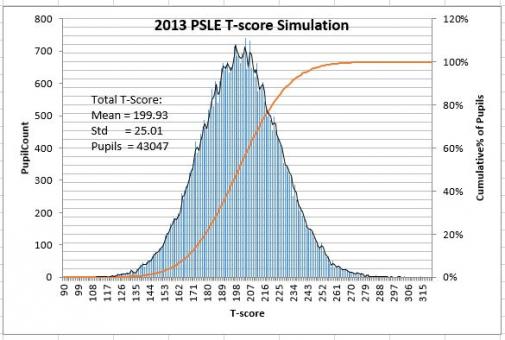
Note: the above results are based on the parameters specified in the chart. Only MOE/SEAB knows the accurate std value. The std of 25 in above chart is just my estimation. Please use the data wisely to make your own decisions.
2. How could the simulated T-score distribution help us?
From the simulation data (std=25), we could predict the cut-off points for different streams.
|
P6-2013 Non-Affiliated |
Normal (T) |
Normal (A) |
Express
|
Tscore >=233 |
Tscore >=250 |
Tscore >=260 |
| Min | ~152 | ~173 | ~190 | |||
| Max | ~172 | ~189 | 275 (?) | |||
| Pupils | 4575 | 8631 | 28778 | 4311 | 1107 | 415 |
| Pupils% | 10.63% | 20.05% | 66.85% | 10% | 2.57% | 0.96% |
|
Pupils% (MOE) |
10.90% | 19.90% | 66.70% |
If we compare the predictions with MOE’s official data listed at the bottom of the table, this simulation results are pretty close in terms of streams%. Note: The above predictions are very sensitive to the std value. If std changes, the cut-off point and % all will change.
We could also compare the predictions with 2012 & 2011 cut-off T-score data (summarized from MOE data). For Express stream, predicted 190 for 2013 is close to last two year cut-off point of 188. Other two streams are also in the range. Why the minimum cut-off points raised up? Please see explanations in next section.
|
Non-Affiliated |
Normal (T) |
Normal (A) |
Express (+AT) |
Express Only |
| Min (2012) | 72 – 151 | 152 – 199 | 188 – 246 | 234 – 265 |
| Max (2012) | 143 – 159 | 179 – 199 | 215 – 274 | 250 – 284 |
|
|
||||
| Min (2011) | 72 – 150 | 152 – 198 | 188 – 245 | 232 – 262 |
| Max (2011) | 141 – 159 | 180 – 199 | 220 – 267 | 251 – 283 |
3. Why are the top scores of PSLE 2013 lower than previous years?
As you can see, there is a list of top scores from the KSP web site. The highest so far is about 275.
The MOE minister also explained that PSLE 2013 papers are designed for pupils to gain marks of difficult questions step by step. So more pupils would get higher raw scores (name it as x). This will push up the average score of the whole cohort. The standard deviation won’t change too much. So according to the t-score formula:
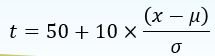
The numerator will be smaller – that’s why the t-score will be lower.
Some pupils felt that this year’s Math is easier, they would expect to get full raw mark of 100. Since x is capped at 100 maximum, higher average scores make it impossible for pupils to reach higher t-score. See the following examples below – a 6.7 marks of t-score difference!
t=50+10*(100-65)/15=73.3
t=50+10*(100-75)/15=66.7
I would say that the improvements of this year’s PSLE papers will push lower scores up (so the average is higher) and drag down the top scores a little bit. So it’s reasonable to say that the cut-off mark for each stream should go up.
I am sharing these analysis and data with you. Please be mindful to make your own decisions – if you are using some of analysis results above (which are based on mathematical simulations) as reference.
If it helps, do let me know. But I am not taking any legal responsibilities of above sharing 🙂
Regards,
A P6 Boy’s Father
Mother Tongue exemption
Hi!
Thanks to share your thought on T-Score prediction. My son has been exempted from Mother Tongue (MT), hence the exam score will not be included, afaik.
In this regard, how to calculate T-Score if kid is exempted from MT?
Many thanks for reply.
Regards,
ChandraShin
PSLE 2013 top 10% is
PSLE 2013 top 10% is confirmed with 248 aggregate score. MOE had given out scholarships to those getting 248 and above!
EESIS Cut Off
Hi all,
I am new here….just a comment…I may be wrong but I understand that there were GEPpers who were given EESIS with 247…. How would that affect the calculations.
Monte Carlo simulation
Just want to highlight that the name of the simulation should be Monte not Monto.
Anyway, good analysis!
If 250 is indeed the top 10% mark
In a normal distribution, the only value that can remain constant is the mean which is 200 for psle (as there are 4 subjects with equal weightage).
The top 3% mark changes over the years. However, I still can’t understand why the top 10% mark can remain consistently at 250.
Maybe it’s not official that 250 is the top 10% mark. Just hearsay from this forum?
What we know is that if 250 is indeed the top 10% mark, there is crowding among the top 4% to 10%. They are squeezed into a narrower range of 250 to 258 (over 9 points) instead of 250 to 263, 261 (over 12,14 points) in the previous years.
It will be very interesting to see how the concavity in e region below the 250 behave, bearing in mind the graph still has to meet the mean at 200, the 50th percentile.
My concern is that with changes to COP of different schools, some students and parents may ‘under choose’. Opting for schools that in the end have COP comfortably below theirbt score. This will lead to schools with lower COP receiving students of higher calibre and so creating the desired effect of all schools being good schools.
Good schools are of course not confined to producing good grades
Standard deviation
thank you Xiaofanz!
I did some calculation regarding EESIS.
Hi, I did some calculation regarding EESIS. Like to share here:
1. According to info from other thread, 3% of pupils are offered EESIS. This year, there are 43000 pupil sit for PLSE. 3% x 43000 = 1290
2. I have also checked student population of independent schools as follow:
ACS 125
HCI 400
Methodist Girl 410
NYGH 400
NUS High 170
RGS 400
RI 400
SOTA 200
SST 200
SCGS 400
Sports school 200
SJI 300
TOTAL: 3605
Assume that total intake of independent school is 3605, one third of them are offered EESIS: 3605 ÷ 3 = 1201
From method 1 and 2, we can conclude that about 1200 to 1300 of pupils are offered EESIS.
Hi Jeju17, Below are what I
Hi Jeju17,
Below are what I got from MOE website. Not sure whether MOE will make it exactly 10% for 3rd language – it might be 9.6%. Did MOE officially said top 10% COP is 251? Or it’s just your reasonable guess? 🙂
******************below are from MOE website
http://www.moe.gov.sg/initiatives/edusave/funds-grants-awards/
Edusave Entrance Scholarships for Independent Schools
For students in Independent Schools
The Edusave Entrance Scholarships for Independent Schools (EESIS) are awarded to Singaporean students who are in the top one-third of the total number of Secondary One students admitted to all independent schools, based on their PSLE results.
http://www.moe.gov.sg/education/secondary/language-programmes/
HMTLs (HMTL)
Pupils who offer Mother Tongue Language (MTL)(i.e. Chinese/ Malay/ Tamil) or HMTL (i.e. Higher Chinese/ Higher Malay/ Higher Tamil) at the PSLE and
are ranked among the top 10% of the PSLE; or
are in the top 11% – 30% band who meet the language criteria (i.e. an A* grade in the MTL or at least a Merit in the HMTL)
may opt to study HMTL at secondary schools. They may offer English Language and HMTL in the GCE ‘O’ Level Examination at the end of Secondary Four.
Foreign Language Programmes
Pupils who are ranked among the top 10% of the PSLE and who have a special ability in languages are eligible to apply for approval to study a foreign language (i.e. French/ German/ Japanese) from S1.
Eligible top 10% pupils can apply for French/ German/ Japanese online upon the release of their PSLE results. Pupils opting for Japanese Language are required to have passed Higher Chinese/ Chinese at the PSLE as the standard written form of Japanese uses Kanji (Chinese characters). In the event that the number of applicants exceeds that of vacancies, selection will be based on their PSLE results. To be eligible for the Foreign Language Programme, the applicant OR his father OR his mother must be a Singapore Citizen or Singapore Permanent Resident.
Dear GreenA, 1. Agree with
Dear GreenA,
1. Agree with you.
2. 250 and 258 as top 10% & top 3% cannot be both true.
If both are true, they should generagte very close sigma.
Given the size of pupils, it should be very close to normal distribution. But it could be that the upper curve near top is a little bit fat.
Regards,
Xiaofanz
Sorry my bad U already did
Sorry my bad
U already did that with brown line
Cheers
Bell curve should skew to the right
Hi , thank you for the very good analysis.
I am in the opinion that the bell curve should skew to the right since more than 66% are in the express stream.
Possible to do a simulation on thiis?
Best rdgs
Dear CTan2010 and
Dear CTan2010 and Notprefect,
I started with 2012 data before. Every year the mean of total T-score should be 200. It’s proved by simulations. Also look the t-score formula, 4×50=200.
That’s the beauty of t-score system. The goal is to have t-score distribution relatively stable, so the cut-off points won’t vary too much form year to year although the sigma(std) varies every year.
Regards,
XiaofanZ
Dear XiaoFanZ, I learnt
Dear XiaoFanZ,
I learnt statistic some twenty years ago. So I can’t claim confidence in analysis. However:
1. When we know Z value, do we need to care about Mean and Std? Isn’t that Z value along can establish a pupil’s position on standard normal distribution curve? Z can be easily derived from T-score.
2. The revised tables predict very closely the COP of N, A, Express streams. However, it differs significantly on the top 10% and top 3% from reported values. The simulated values are 233 and 250, reported and verified values are 250 and 258. Can we conclude that in the upper half region, distribution is not normal?
3rd language option
Did your son get the cat3 third language option? I understand that majority of students will get the cat1 and 2 -Malay, Arabic,Indonesian options but only those with Tscores of 251 and above are allowed to take the French, German ,Japanese and Spanish options. Please clarify your son’s status.
Cut off point for third language
I understand that majority of students will be offered third language options but The difference is that the COP for students being offered the Cat 3 options of French, Japanese,German and Spanish is Tscore of 251 and above. All the rest will be offered the Malay, Arabic, Indonesian language options. So the so called top 10% COP is actually officially 251. I have two friends whose daughters got 250 and 251 respectively and only the 251 got offered the cat 3 third language options.
Spot On!
Hi XianFanZ,
Ctan2013 had validated the accuracy of your computation.
Would be interesting to see your calculation for 2012 mean. Do tell.
Cheers,
notprefect
Question
Thank you for the impressive analysis! Could you please help to clarify the following? I don’t understand this part…
MOE stated in their website that the top 10% PSLE students are offered foreign languages such as French, German, Japanese and Spanish. So far, there is a parents here who wrote that his/her child is offered foreign language while the child has t-score of 248. So, I assume that the cut-off point for the top 10% PSLE students is 248.
http://www.moe.gov.sg/education/secondary/language-programmes/
However, in the blog you wrote that the top 10% COP is 233.
Are we talking about different cut-off point?
TIA
Hi Xiaofanz, I endorse your
Hi Xiaofanz,
I endorse your 2nd calculation. I attended a school presentation on 22Nov and the principal mentioned the national mean this year is 199.x. I can’t remember the number x but it’s not 9. But excellent statistical work on your part.
Would you thus be able to advise the mean for 2012 using the same method? Thank you.
BR,
Ctan2013
3rd language
Hi,
My son is offered a third language option, and his score is 248. Just to share.
Information Given by MOE Helpdesk
I called to ask if the cut off points for each school will come down since top score is 275 if I am updated as of today.
Helpdesk Officer shared that lasxt year 48K students sat for PSLE. This year 43K students sat for PSLE. So demand for schools is lower of than last year,
But Officer shared that Top schools will normally not decrease intake, but neighbourhood schools may reduce number of classes. His advice was to call the school to ask if there is any intention of reducing number of classes.
another point that came to my mind is extra 3% of cohort of 43K equals to 1290 students. There might be more competition for neighbourhood secondary schools since more students now join the express stream..
I am not sure if my analysis is correct. I am concerned as my chils scored 207 in the borderline competition for 200 – 210 range schools..
please read std definitions
please read std definitions here
http://en.wikipedia.org/wiki/Normal_distribution
Hi, I have revised the top
Hi, I have revised the top 10% COP in the blog – it should be 233. Please read the revised analysis.
Please read this
Please read this http://en.wikipedia.org/wiki/Central_limit_theorem.
I am 100% sure that total T-score is approximately normally distributed.
The difficult part is what’s the sigma (std) which will change every year.
Thanks for sharing 250 and
Thanks for sharing 250 and above are offered 3rd-language options.
Based on my latest simulation data, I could see there are 1107 pupils with T-score >=250 which is about 2.57%.
Also I could see there are 500 pupils with T-score >= 258 which is the EESIS cut-off point.
Top 10% should be T-score >= 233. If you read last year data carefully, you could find that for schools with Express stream only the T-score cut-off point is 234.
Hope it helps.
Regards,
Zhang Xiaofan
Hi Jollygooddaddy, 1. What I
Hi Jollygooddaddy,
1. What I mean is higher average of raw scores which are used to calculate t-scores.
2. Thanks for your questions. You make me thinking harder for last 2 nights. The revised writing above should give you the answer.
Regards,
XiaofanZ
Hi GreenA, It's a long story
Hi GreenA,
It’s a long story of calculating sigma (std) for raw scores and t-score. We could discuss it later face-to-face if we meet in future.
Please see my revised analysis above. Hope it’s more clear.
Only MOE/SEAB knows the accurate value of std for total T-scores. We are all try our best to make an intelligent guess.
Regards,
XiaofanZ
Z
Hi,
I think I used a wrong term. What I discussed in the previous post shall be ‘Z’, not Sigma. Sigma is standard deviation.
How do you calculate the Sigma
Hi, XiaoFanZ,
Thank you for your valuable data. However, I have a question regarding Sigma. In your graph, 1 Sigma = 220, 2 Sigma = 240, 3 Sigma = 260
From my understand of T-score calculation:
Subject score = 50 + 10 * (Raw score – Mean) / Standard-Deviation
We can call the part (Raw score – Mean) / Standard-deviation Sigma, which is defined in statistic.
So that we can write as follow:
Subject score = 50 + 10 * Sigma
T-score = summation of Subject Score of all four subjects
Therefore, suppose a pupil’s T score is 260. His average subject score is 260 / 4 = 65
Sigma value is (65 – 50)/10 = 1.5
Check the Standard Normal Distribution table, area below sigma 1.5 is
0.5 + 0.4332 = 0.9332
That means: a child with T-score of 260 stands at 93.32% of his cohort.
Each and every year, regardless of Mean and Standard Deviation, a child of 260 T-score stands at same place of 93.32%.
However, from this year’s discussion, I come to understand that the EESIS was offered to top 3% of pupil. And each year, the cut off point for EESIS is different:
2013: 258
2012: 263
2011: 261
2010: 260
if the the cut off point of EESIS does points to top 3%, then it is contrary to my above calculation.
Does this means the PSLE result is actually not a normal distribution? Or is there anything wrong with my interpretation of the T-score?
Believe you are an expert in this area. Can you please kindly comment?
PSLE 2013 statistics
Hi Xiaofanz,
I was very impressed by your statistical calculations – I thought you did a wonderful piece of work !
I have some questions which I hope you could provide some advise:
1. What is the basis for assuming a standard Bell curve since the news that’s going around assumes a higher t-score average?
2. Most of the time we assume a Standard Bell curve for this PSLE 2013. Could it be that this time the curve could be “skewed” towards the 240-260 range of t-score?
Thanks & Best Regards,
jollygooddaddy
Impressive!
This is simply impressive!
If the PSLE score were indeed
If the PSLE score were indeed a simple normal distribution, then it would have the same proportions every year. However, it’s not because it is the sum of four normalised scores with different sigmas. So we have some sort of bell curve (z distribution), but we don’t know what exactly. Hence the idea of simulating. Maybe to smooth the curve we should simulate a million students, bearing in mind some are exempt from 2nd lang… (and also, that the t-scores are weighted differently!) 🙂
Thought top 10% COP is 250...
wow, great analysis. MOE should definitely share such information with parents.
One question on the top 10% COP though. From the other discussion threads, it seems that this year top 10% COP is 250 based on the students who were offered 3rd language. This, coincidentally, is the same as 2012, With this mind, how does that change your curve? A large concentration of students between 240 – 250? Will be great if this can be input into the model so that we can have an estimation of how large this population is so that we can forecast the chance of the school postings. Thanks!
Hi Steadymama, Please see
Hi Steadymama,
Please see point 4 in above blog for top 10% COP. Do use simulation data wisely and make your own decisions 🙂
Dear xiaofanz, I'm not sure
Dear xiaofanz,
I’m not sure why you can’t edit your comment. In any case, I have converted your comment into your own blog article. You should be able to freely edit the article now :), and also to respond to comments.
Standard deviation
Thank you Xiaofanz!
How is the standard deviation derived from the raw scores?
Hi Chief, Thanks for the
Hi Chief,
Thanks for the encouragement. I benifited from this web site. Now I am contributing back to the community.
It seems that I could not edit my original post (with graphs and formula). I’d like to add some points and answer some questions in the original post. Can you enable me do so?
Regards,
XiaofanZ
Hi,As the news said: PSLE
Hi,
As the news said: PSLE papers tweaked to better test understanding. Easier papers will make everyone get higher raw scores, so the averages are higher. But the difference of the pupils academic capabilities won’t change much regardless of difficulty levels – that’s why the deviation won’t change much.
I didn’t say the deviation is constant when the difficulty levels varies. In my example of t-score formula, I fixed the deviation to 15, changed the averages to demostrate what is the impact to the t-score even the raw score is full mark 100. Fix one variable, and see the other variable’s impact.
水涨船高,但是船本身的高度不会因为水涨而变高。
Hope it helps.
Regards,
XiaofanZ
Hi, It's all based on public
Hi, It’s all based on public information and mathematical simulation.
Regards,
XiaofanZ
WOW
Gosh! I wonder where you get so much information!
Marvellous!
Excellent analysis, thanks
Excellent analysis, thanks for the insights!
PSLE Results Analysis
Dear clever P6 boy’s father.
Can you comment based on your analysis the predicted COP for top 10% ? This insight can shed some possibilities for selection of IP. Especially boderline t scores that hovers around 245-249.
Grateful.
The explaination of tscores
The explaination of tscores and distribution curve is very helpful. Based on this analysis, can anyone project the top 10% COP?
This woild be useful in the decision for IP school choice selection. This year’s results throws a whack in grasping this challenging guessing game.
Any thoughts will be gladly received.
Thank you xiaofanz for your
Thank you xiaofanz for your very useful analysis. Can you explain why the deviation remains constant when the difficulty level changes? I expect the deviation to be smaller in an easier paper.
wow
WOW indeed!! Thanks!
Wow!
Now, this is what I call ANALYSIS! Fantastic research work.
Good analysis. But how can i
Good analysis. But how can i understand it to relate to school selection? Can you please elaborate?
PSLE 2013 - Results Analysis
Editor’s Note:
Original contents of comment have been copied into the blog article above.